Container Network Packet Drop in AKS
Investigating and mitigating a curious case of container network packet drop in AKS (Azure Kubernetes Service)
During a recent system outage, our Azure Kubernetes Service (AKS) clusters experienced a peculiar issue. Specifically, some containers suffered packet drops, causing network connectivity problems.
Our AKS clusters run containerized workloads, managed by Cluster API (CAPZ). Each node pool is a Virtual Machine Scale Set (VMSS), which we manage indirectly through the AKS layer.
During the outage, certain workloads on a specific node were affected. Initially, we resolved the issue by cordoning off the node and migrating the workloads. However, the problem recurred shortly after. The primary symptom was a significant increase in network packet drops.
For container network drops, we are relying on metrics exposed by cadvisor:
container_network_receive_packets_dropped_total
container_network_transmit_packets_dropped_total
Investigation
After identifying the packet drop issue, we initiated an investigation to ascertain if network throttling was occurring at the VM level, and sought the help of Azure Support for a thorough examination.
Another common symptom for all problematic nodes was a VM Freeze event, which was observed in the node status conditions. A VM Freeze event can occur due to a variety of reasons, according to Azure documentation.
The Virtual Machine is scheduled to pause for a few seconds.
CPU and network connectivity may be suspended, but there's no
impact on memory or open files.
But we have no more visibility on the internals of an Azure VM Freeze event. The preliminary findings from Azure Support indicated no anomalies with the VM, suggesting a review of any alterations in workload behavior. Concurrently, we conducted iPerf tests and captured tcpdump data on our end to delve deeper into the nature of the packet drops and to gain more insights into the network performance hindrances we were facing.
Root Cause Analysis
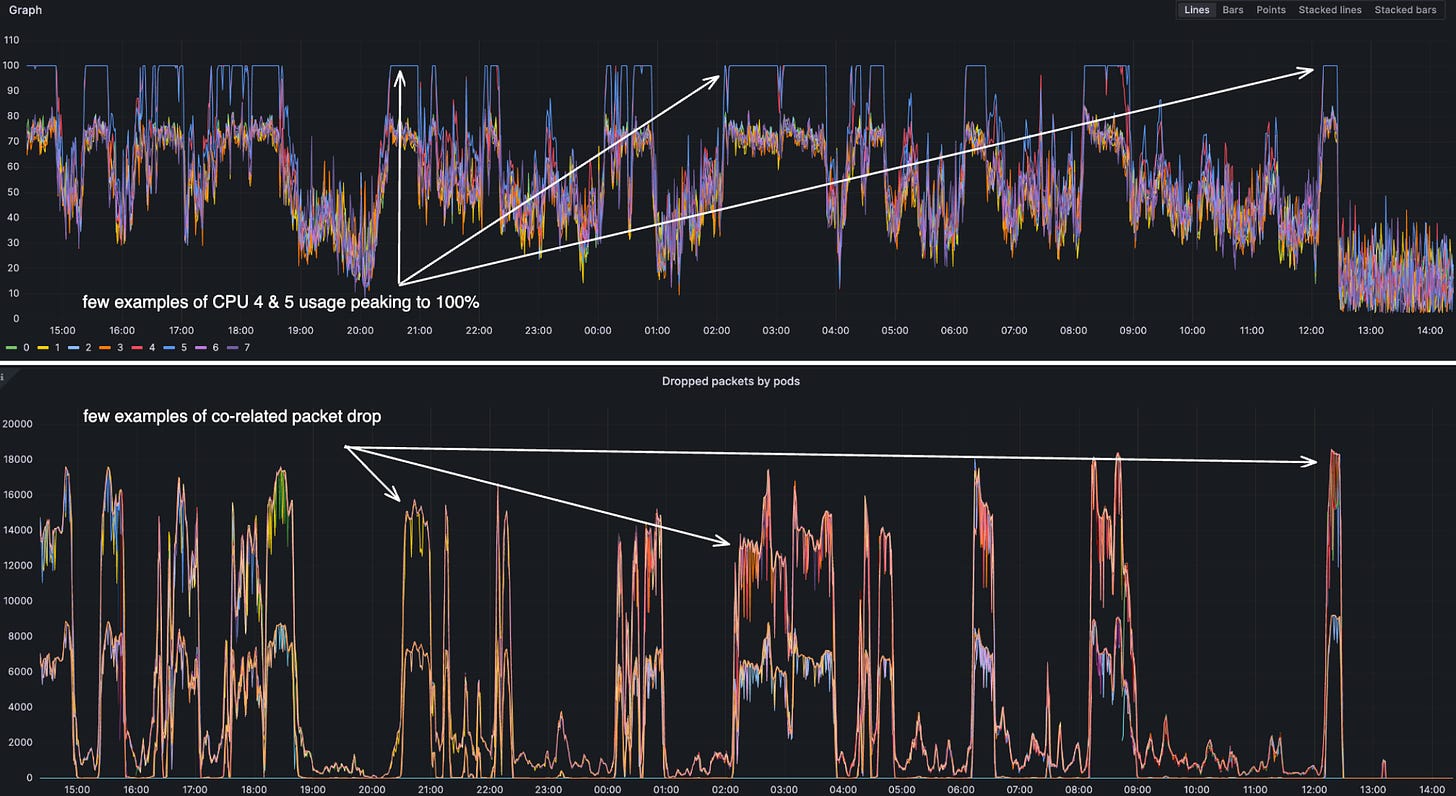
An intriguing observation was made regarding CPU utilization on the affected node, where it was noticed that one core was being utilized at 100%, while the remaining cores exhibited significantly lower levels of utilization.
This second metric was coming from node-exporter:
node_cpu_seconds_total{} by (cpu)perf results
The next thing I did was to run a perf on the node to see what was causing the CPU to spike.
perf record -C 5 -a -g -D 99 -- sleep 60
results show that the CPU is being consumed by ksoftirqd/5 process
...
  Children      Self  Command          Shared Object
+   99.40%     0.00%  ksoftirqd/5      [unknown]
+   99.34%     0.00%  ksoftirqd/5      [unknown]
+   99.18%     0.00%  ksoftirqd/5      [unknown]
+   99.12%     0.00%  ksoftirqd/5      [unknown]
...
ksoftirqd
ksoftirqd led me to inspect the softirqs. To do this, I had to check the interrupts on the node.
cat /proc/interrupts

     CPU0  CPU1  CPU2  CPU3       CPU4       CPU5  CPU6  CPU7
  4:   0     0   538     0          0          0     0     0
  8:   0     0     0     0          0          0     0     0
  9:   0     0     0     0          0          0     0     0
 24:   0     0     0   586          0   82868004     0     0
 25: 728     0     0     0  869041985          0     0     0
 26:   0   864     0     0          0  813776462     0     0
 27:   0     0  1439     0  838852829          0     1     0
 28:   0     0     0  1545          0  781818909     0     1
 29:   1     0     0     0 1234309153          0     0     0
 30:   0     1     0     0          0 1262389002     0     0
 31:   0     0     1     0  853755079          0  1172     0
 32:   0     0     0     1          0  812015919     0  1417
We can clearly see that CPU 4 and CPU 5 are handling way more interrupts than the other CPUs.
smp_affinity
Next thing which I did was to check the smp_affinity of the interrupts.
for i in {24..32} ; do cat /proc/irq/$i/smp_affinity; done
20
10
20
10
20
10
20
10
20
The values 20 and 10 are hexadecimal representations of the CPU core assignments. Specifically, 20 means IRQs are handled by CPU 5, and 10 means they're handled by CPU 4. So we can see that the interrupts are being handled by CPU 4 and CPU 5. This explains the CPU spike on CPU 4 and CPU 5. This also explains the packet drop on the containers running on the node.
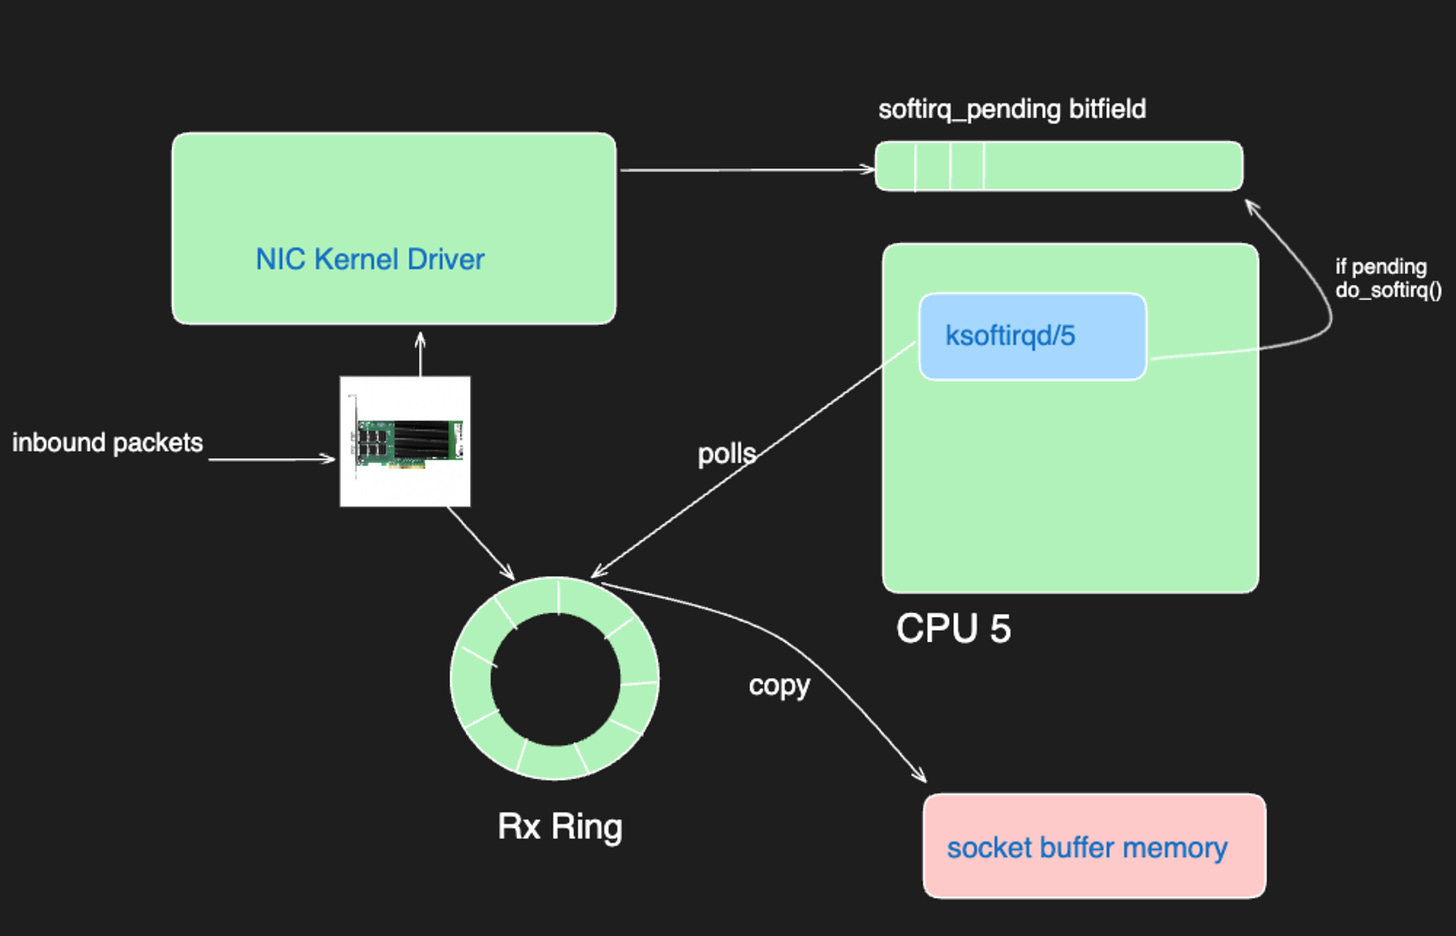
To understand better, we need to remember how interrupts are handled in Linux.
In this scenario, the observation of ksoftirqd5 being at 100% CPU utilization indicates a condition wherein the CPU 5 is exhaustively engaged in the handling of interrupts. This state precludes the CPU from accommodating any further interrupt requests, thereby creating a consequential situation where network packets are being discarded. The saturated utilization of the CPU 5 for interrupt handling delineates a bottleneck in the system's capability to process additional interrupts, manifesting as network packet drops.
Just to double-check if this is a common configuration on Azure VMs, I checked the smp_affinity of the interrupts on another node belonging to the same VMSS, which did not have a VM Freeze event yet.
for i in {24..32} ; do cat /proc/irq/$i/smp_affinity; done
40
80
10
80
04
20
08
01
02
IRQBalance
We can see that the interrupts are balanced across all the CPUs. So what is wrong with our node? Why is it not balanced?
Let's check the irqbalance service status
service irqbalance status
● irqbalance.service - irqbalance daemon
     Loaded: loaded
     Active: active (running)
       Docs: man:irqbalance(1)
irqbalance is running. But we are definitely not seeing the interrupts distributed across all the CPUs.
systemctl try-restart irqbalance
And right after restarting irqbalance, I could see that the IRQs are balanced across all the CPUs. Packet drop was gone, and CPU utilization was back to normal.
Automated Mitigation
Now that we know what was happening with VM Freeze events and packet drops, and we have a manual mitigation of the issue. It was time for an automated mitigation.
The available metrics can allow us to dig into the number of interrupts and group them by devices or cpu for example. But there is no available metric which can tell us about smp_affinity of the interrupts.
We already have a Daemonset running on all the nodes. So we decided to leverage that to automate the mitigation of the issue. So we extended our existing compute Daemonset to do the following:
emit metrics about the smp_affinity of the interrupts
if the smp_affinity is not balanced, label the node
Now we not only have metrics about the smp_affinity to have observability into the issue, but also we were labelling the node to set the stage for an automated mitigation.
The mitigation was simple at this point.
A new
DaemonSetwithnodeSelectorconfigured to select the problematic nodes with the label
run
nsenter -t 1 -m -n -i systemctl try-restart irqbalancein the container of the newDaemonset
As soon as after a VM Freeze event was leaving our nodes in a problematic state we were able to mitigate the issue automatically.
This is just a temporary mitigation. As this is as far as we can go as users of a managed AKS cluster.
Azure is still investigating this issue, and we are waiting for a permanent fix. Also for most users working with limited network interrupts capacity might not be an issue at all. You can only identify this issue if you are taking the node to substantial network usage.
For this post I used the example of an 8 cores VM. But this issue can happen on any VM size. We observed it in 16,32 and 64 cores VMs. Bigger the node, bigger the issue was due to the proportion of the interrupts capacity.
Conclusion
This was a very interesting case. It was a great learning experience, specially a great reminder on where we are standing as users of a managed Kubernetes cluster.
We are not living in a world where running a managed Kubernetes cluster is a set and forget thing. It's imperative to understand the cluster's internals and possess the capability to debug issues at the cluster level.
Managed services support is great, but it's not a replacement for the knowledge of the internals of the system you are running.
I'm 100% confident that Azure engineering will solve this problem, and we will not have to deal with this issue anymore. But meanwhile if that happens we have to be prepared to dig into the internals of the system and be able to mitigate the issue ourselves.
[update] 10/10/2023: Azure engineering has identified the issue and is rolling out a fix in the next few weeks. This was a bug in irqbalance
The upstream irqbalance 1.9.0+ has been fixed.


